30.00$ - Purchase this E-book
Category : Higher Education
Part 1: Gathering and Exploring Data 1. Statistics: The Art and Science of Learning from Data 1.1 Using Data to Answer Statistical Questions 1.2 Sample Versus Population 1.3 Using Calculators and Computers Chapter Summary Chapter Problems 2. Exploring Data with Graphs and Numerical Summaries 2.1 Different Types of Data 2.2 Graphical Summaries of Data 2.3 Measuring the Center of Quantitative Data 2.4 Measuring the Variability of Quantitative Data 2.5 Using Measures of Position to Describe Variability 2.6 Recognizing and Avoiding Misuses of Graphical Summaries Chapter Summary Chapter Problems 3. Association: Contingency, Correlation, and Regression 3.1 The Association Between Two Categorical Variables 3.2 The Association Between Two Quantitative Variables 3.3 Predicting the Outcome of a Variable 3.4 Cautions in Analyzing Associations Chapter Summary Chapter Problems 4. Gathering Data 4.1 Experimental and Observational Studies 4.2 Good and Poor Ways to Sample 4.3 Good and Poor Ways to Experiment 4.4 Other Ways to Conduct Experimental and Nonexperimental Studies Chapter Summary Chapter Problems Part 1 Review Part 1 Questions Part 1 Exercises Part 2: Probability, Probability Distributions, and Sampling Distributions 5. Probability in Our Daily Lives 5.1 How Probability Quantifies Randomness 5.2 Finding Probabilities 5.3 Conditional Probability: The Probability of A Given B 5.4 Applying the Probability Rules Chapter Summary Chapter Problems 6. Probability Distributions 6.1 Summarizing Possible Outcomes and Their Probabilities 6.2 Probabilities for Bell-Shaped Distributions 6.3 Probabilities When Each Observation Has Two Possible Outcomes Chapter Summary Chapter Problems 7. Sampling Distributions 7.1 How Sample Proportions Vary Around the Population Proportion 7.2 How Sample Means Vary Around the Population Mean 7.3 The Binomial Distribution Is a Sampling Distribution (Optional) Chapter Summary Chapter Problems Part 2 Review Part 2 Questions Part 2 Exercises Part 3: Inferential Statistics 8. Statistical Inference: Confidence Intervals 8.1 Point and Interval Estimates of Population Parameters 8.2 Constructing a Confidence Interval to Estimate a Population Proportion 8.3 Constructing a Confidence Interval to Estimate a Population Mean 8.4 Choosing the Sample Size for a Study 8.5 Using Computers to Make New Estimation Methods Possible Chapter Summary Chapter Problems 9. Statistical Inference: Significance Tests about Hypotheses 9.1 Steps for Performing a Significance Test 9.2 Significance Tests about Proportions 9.3 Significance Tests about Means 9.4 Decisions and Types of Errors in Significance Tests 9.5 Limitations of Significance Tests 9.6 The Likelihood of a Type II Error (Not Rejecting H0, Even Though It’s False) Chapter Summary 10. Comparing Two Groups 10.1 Categorical Response: Comparing Two Proportions 10.2 Quantitative Response: Comparing Two Means 10.3 Other Ways of Comparing Means and Comparing Proportions 10.4 Analyzing Dependent Samples 10.5 Adjusting for the Effects of Other Variables Chapter Summary Part 3 Review Part 3 Questions Part 3 Exercises Part 4: Analyzing Association and Extended Statistical Methods 11. Analyzing the Association Between Categorical Variables 11.1 Independence and Association 11.2 Testing Categorical Variables for Independence 11.3 Determining the Strength of the Association 11.4 Using Residuals to Reveal the Pattern of Association 11.5 Small Sample Sizes: Fisher’s Exact Test Chapter Summary 12. Analyzing the Association Between Quantitative Variables: Regression Analysis 12.1 Model How Two Variables Are Related 12.2 Describe Strength of Association 12.3 Make Inference About the Association 12.4How the Data Vary Around the Regression Line 12.5 Exponential Regression: A Model for Nonlinearity Chapter Summary 13. Multiple Regression 13.1 Using Several Variables to Predict a Response 13.2 Extending the Correlation and R-squared for Multiple Regression 13.3 Using Multiple Regression to Make Inferences 13.4 Checking a Regression Model Using Residual Plots 13.5 Regression and Categorical Predictors 13.6 Modeling a Categorical Response Chapter Summary 14. Comparing Groups: Analysis of Variance Methods 14.1 One-Way ANOVA: Comparing Several Means 14.2 Estimating Differences in Groups for a Single Factor 14.3 Two-Way ANOVA Chapter Summary 15. Nonparametric Statistics 15.1 Compare Two Groups by Ranking 15.2 Nonparametric Methods For Several Groups and for Matched Pairs Chapter Summary PART 4 Review Part 4 Questions Part 4 Exercises Tables Answers Index Index of Applications Photo Credits Table of Contents
Chapter Problems
Chapter Problems
Chapter Problems
Chapter Problems
Chapter Problems
Chapter Problems
Chapter Problems
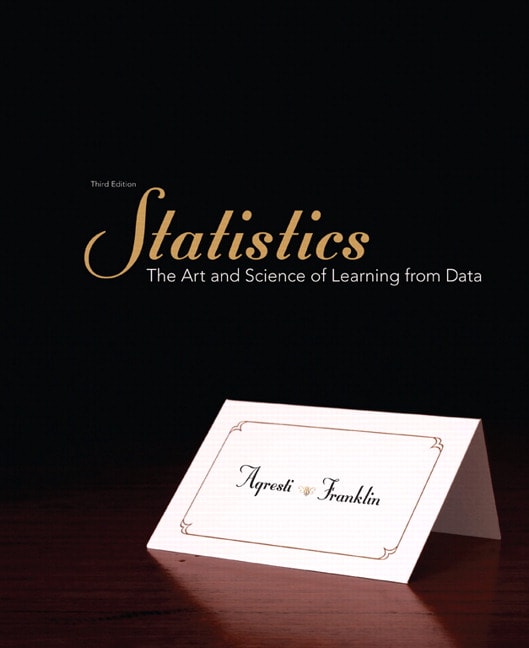
Get Statistics: The Art and Science of Learning from Data (Subscription), 3rd Edition by Alan Agresti, University of Florida Christine A. Franklin, University of Georgia


0 commentaires:
Enregistrer un commentaire